

Look up long enough, and almost anything can start to feel mysterious — a blinking light, a streak across the sky or something that definitely wasn’t just a plane. UFO sightings have been part of American pop culture for decades, inspiring everything from late-night debates to alien movies, backyard skywatching and, of course, plenty of out-of-this-world creativity.
To see where close encounters are most common, we analyzed UFO sighting data from the National UFO Reporting Center across all 50 states and the 100 largest U.S. cities. We ranked each place by sightings per 10,000 residents, then looked at when those sightings most often occur, including the most typical date and time for reported activity.
Ready to find out where the skies seem busiest? Let’s take a look.
The States With the Most UFO Sightings
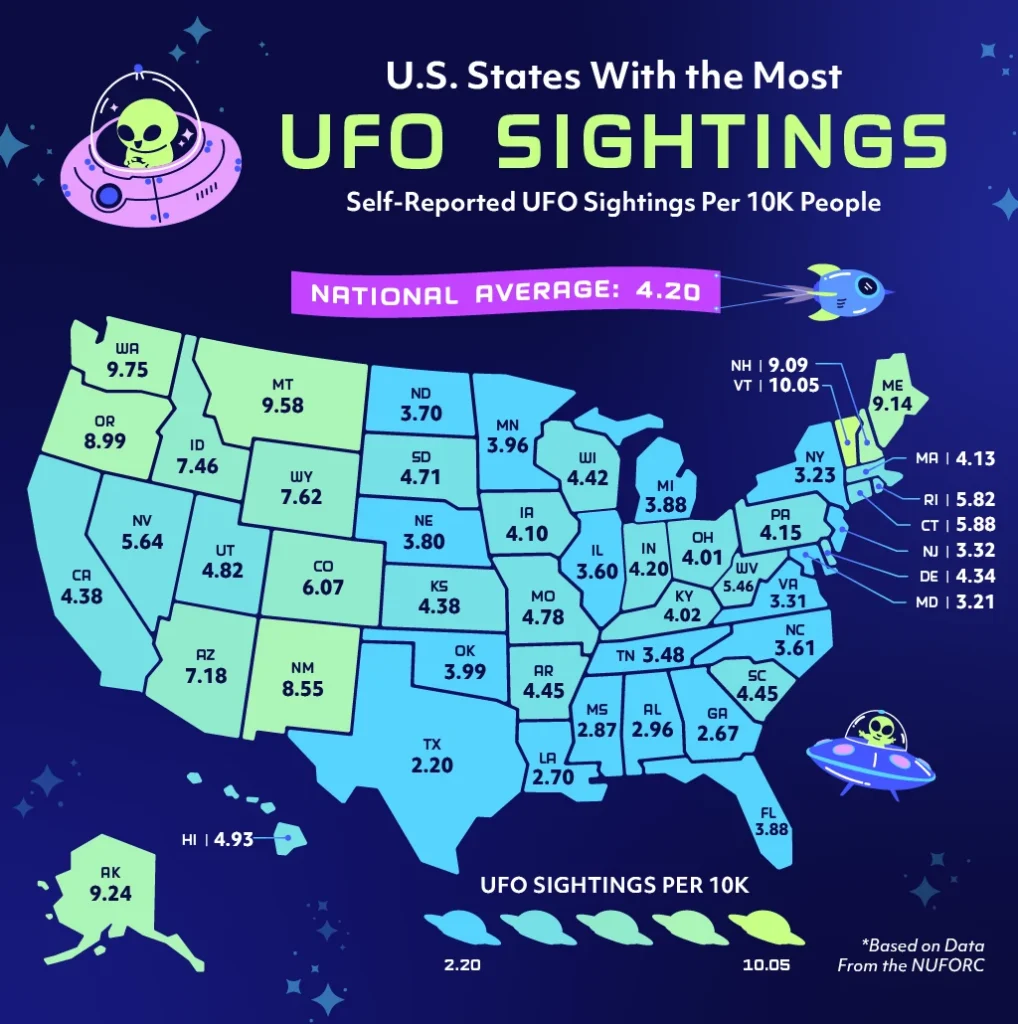
Some people look up at the night sky and see stars. Others apparently see something a little more mysterious.
Across all states in our study, the average was 4.2 UFO sightings per 10,000 people. We also looked at when these close encounters tend to happen. Nationally, the most “typical” sighting date was Aug. 20, and the typical time was about 9:30 p.m. — right when the sky is dark enough for things to get interesting.
States With the Most UFO Sightings
These are the states with the most sightings per 10,000 residents, and the most typical date and hours those sightings happen.
- Vermont: 10.1 sightings per 10K
- Date: Sept. 9
- Hour: 9:16 p.m.
- Washington: 9.8 sightings per 10K
- Date: Aug. 2
- Hour: 9:53 p.m.
- Montana: 9.6 sightings per 10K
- Date: Aug. 20
- Hour: 10:06 p.m.
- Alaska: 9.2 sightings per 10K
- Date: Dec. 16
- Hour: 10:15 p.m.
- Maine: 9.1 sightings per 10K
- Date: Aug. 26
- Hour: 9:27 p.m.
Vermont leads the country, with more than 10 sightings per 10,000 residents, making it the top UFO hotspot in our ranking. The rest of the top five has a clear outdoorsy streak, too. Washington, Montana, Alaska and Maine all have wide-open skies, smaller populations and plenty of places where a strange light overhead might get someone’s attention. Most of these sightings also cluster around late summer, with typical times falling after 9 p.m. Prime stargazing hours may also be prime “Did you see that?” time.
States With the Fewest UFO Sightings
These are the states with the fewest sightings per 10,000 residents, and the most typical date and hours those sightings happen.
- Texas: 2.2 sightings per 10K
- Date: Sept. 8
- Hour: 9:45 p.m.
- Georgia: 2.7sightings per 10K
- Date: Sept. 19
- Hour: 9:56 p.m.
- Louisiana: 2.7sightings per 10K
- Date: Sept. 11
- Hour: 9:22 p.m.
- Mississippi: 2.9sightings per 10K
- Date: Oct. 7
- Hour: 9:22 p.m.
- Alabama: 3.0 sightings per 10K
- Date: Aug. 17
- Hour: 9:04 p.m.
Texas lands at the bottom once population is factored in, even though it has plenty of raw UFO reports overall. The lowest-ranking states are mostly in the South, and their typical sighting times still stick to the same after-dark pattern, usually between about 9 and 10 p.m. So the UFOs may not be avoiding these states completely, they’re just making fewer appearances per person.
The data points to a pretty clear pattern: America’s top UFO hotspots tend to be smaller, more rural or outdoorsy states where the night sky has a little more room to put on a show. Next, we’re zooming in a bit further to find the U.S. cities reporting the most UFO sightings per capita.
U.S. Cities With the Most UFO Sightings
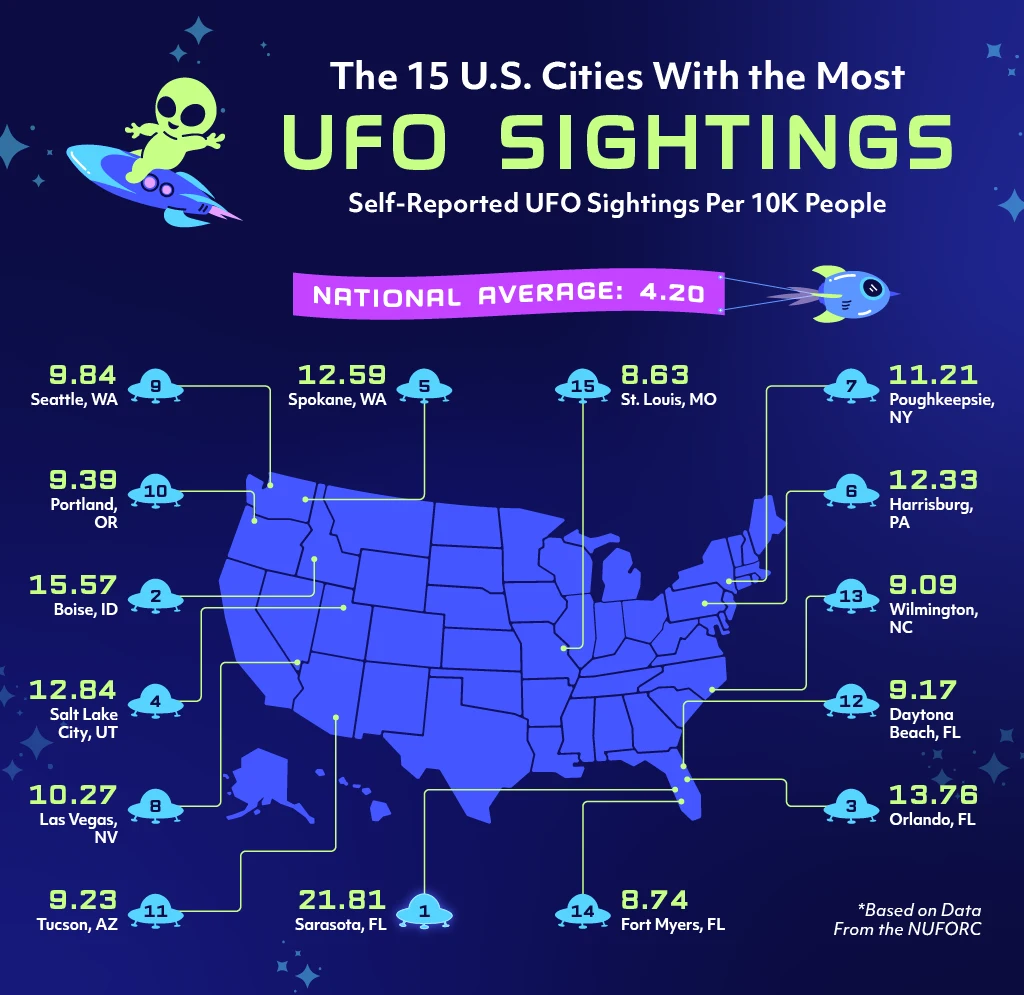
Statewide UFO hotspots are one thing, but the city rankings bring the close encounters a little closer to home. Some places may not cover much ground on the map, but when it comes to strange lights in the sky, they’re reporting plenty of action.
For this part of the study, we ranked the 100 largest U.S. cities by UFO sightings per 10,000 residents. That helped us compare cities big and small without letting population size completely take over the mothership.
Cities With the Most UFO Sightings
These are the cities with the most sightings per 10,000 residents, and the most typical date and hours those sightings happen.
- Sarasota, FL: 21.8 sightings per 10K
- Date: Feb. 4
- Hour: 9:05 p.m.
- Boise, ID: 15.6 sightings per 10K
- Date: Aug. 17
- Hour: 10:40 p.m.
- Orlando, FL: 13.8 sightings per 10K
- Date: May 22
- Hour: 10:03 p.m.
- Salt Lake City, UT: 12.8 sightings per 10K
- Date: July 26
- Hour: 9:52 p.m.
- Spokane, WA: 12.6 sightings per 10K
- Date: Aug. 20
- Hour: 9:23 p.m.
Sarasota takes the top spot by a wide margin, with 21.81 sightings per 10,000 residents. That’s more than five times the national average of 4.2 sightings per 10,000 people across the study. Florida also makes two appearances in the top three, with Sarasota at No. 1 and Orlando at No. 3, giving the Sunshine State some serious flying-saucer credentials. And once again, most of these typical sighting times happen after dark, especially between about 9 and 11 p.m. — a fitting window for any late-night skywatchers hoping for a close encounter.
Cities With the Fewest UFO Sightings
These are the cities with the fewest sightings per 10,000 residents, and the most typical date and hours those sightings happen.
- New York, NY: 1.4 sightings per 10K
- Date: Aug. 20
- Hour: 9:57 p.m.
- McAllen, TX: 1.4 sightings per 10K
- Date: Sept. 27
- Hour: 9:19 p.m.
- Philadelphia, PA: 1.5sightings per 10K
- Date: Aug. 1
- Hour: 9:18 p.m.
- Detroit, MI: 1.6 sightings per 10K
- Date: Aug. 4
- Hour: 8:46 p.m.
- Dallas, TX: 1.8sightings per 10K
- Date: Sept. 22
- Hour: 9:31 p.m.
Some of America’s biggest cities land near the bottom of the ranking. New York has the lowest rate among the 100 largest cities, with 1.43 sightings per 10,000 residents, even though it recorded more than 1,100 total reports in the data.
Philadelphia, Detroit and Dallas follow a similar pattern: Big populations can make even hundreds of UFO reports look smaller on a per-person basis. So while the aliens may still be buzzing over major metros, their appearances are much less common relative to the number of earthlings on the ground.
Overall, the city rankings show that UFO activity isn’t just about size. Smaller and midsize cities like Sarasota, Boise and Spokane rise to the top, while some of the country’s largest cities fall to the bottom. Up next, we’re sharing the full data table so you can see how every state and city in the study stacks up.
When To Spot a UFO Based on Where You Live
UFO sightings can depend on where you are, when you’re looking, and maybe how willing you are to believe that strange glowing dot is more than just a plane. But across thousands of reports, our analysis offers a clearer look at where close encounters are most common, and when they tend to happen.
Curious how your state or city stacks up in the search for unexplained activity? Use the table below to search, sort or scroll through the data to see UFO sightings per 10,000 residents, total reports and the most “typical” date and time people report spotting something unusual in the sky.
Closing Thoughts
Whether you live in a UFO hotspot or a place where close encounters are a little harder to come by, one thing is clear: Americans have reported plenty of strange sights in the sky. From Vermont’s sky-high sighting rate to Sarasota’s spot at the top of the city rankings, the data shows where unexplained activity is most common, and when people are most likely to spot something unusual overhead.
Of course, you don’t need to wait until 9:30 p.m. for a little alien adventure. If this study has you thinking about flying saucers, friendly extraterrestrials and mysterious visitors from beyond the stars, keep the creativity going with alien coloring pages from Yay! Coloring Pages. They’re hand-drawn, printable and ready for your next out-of-this-world coloring mission.
Methodology
To find the places where UFO sightings are most common, we analyzed National UFO Reporting Center data for all 50 states and the 100 largest U.S. cities.
We compared each place’s total number of reported sightings with current population estimates to calculate sightings per 10,000 residents. This helped us compare states and cities more fairly, no matter how many people live there.
We calculated “typical” sighting dates and times using a circular averaging method, since both calendar dates and clock times repeat (e.g., December flows into January, and midnight follows from 11 PM). Each sighting was converted into a position on a circular scale, averaged, and then converted back into a representative date and time to reflect the central tendency of sightings.
Fair Use
You are welcome to use, reference, and share non-commercial excerpts of this study with proper attribution. If you cite or cover our findings, please link back to this page so readers can view the full methodology, charts, and context.